

The Left Hand of Gender
Debunking a Graphic Fallacy

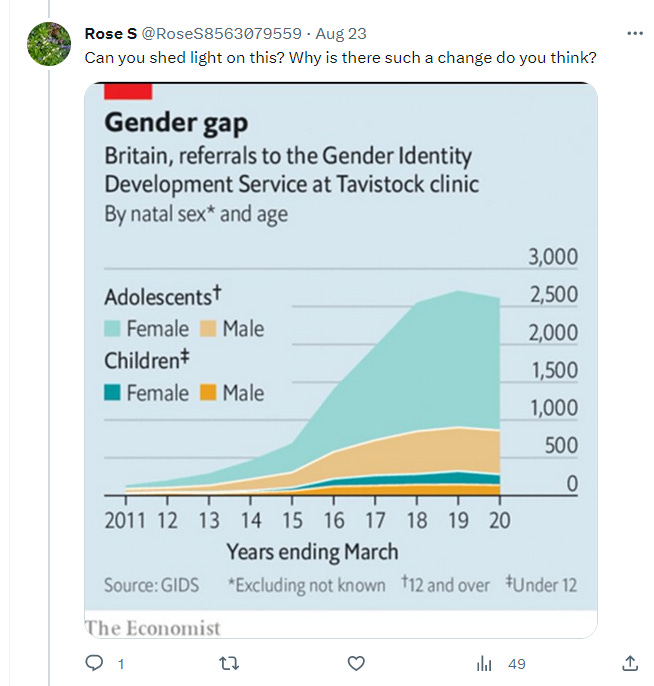
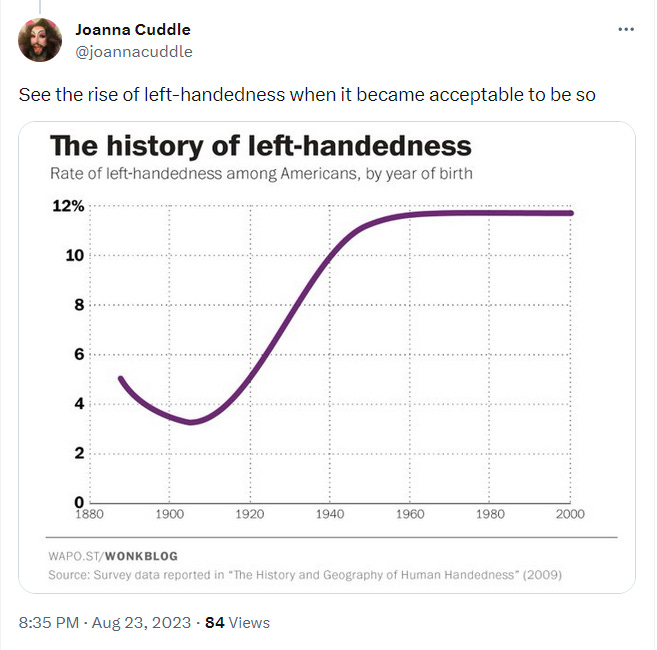
A silly meme that keeps showing up on trans apologist Twitter compares the growth of transgender identification with left handedness. the point being that both became more visible as a result of greater social acceptance. In a typical exchange, someone produces a graph showing the rapid increase in referrals to pediatric gender clinics over the last ten years. The response is a graph of the prevalence of left-handedness, which appears to show a similar curve.
People who use this argument either can’t read a graph or assume others can’t. There has been a lot of talk in progressive circles about an anti-oppression curriculum in math. One thing that would be helpful is teaching more statistics so people can’t be fooled by manipulating data. The misuse of this graph is just one example of pervasive abuse of science and logic to support gender ideology which I discussed in a previous article. The graphic has become a visual version of the “thought-terminating cliché”: an easily repeated slogan which true believers in a cult or ideology use to dismiss counter-arguments without seriously considering them.
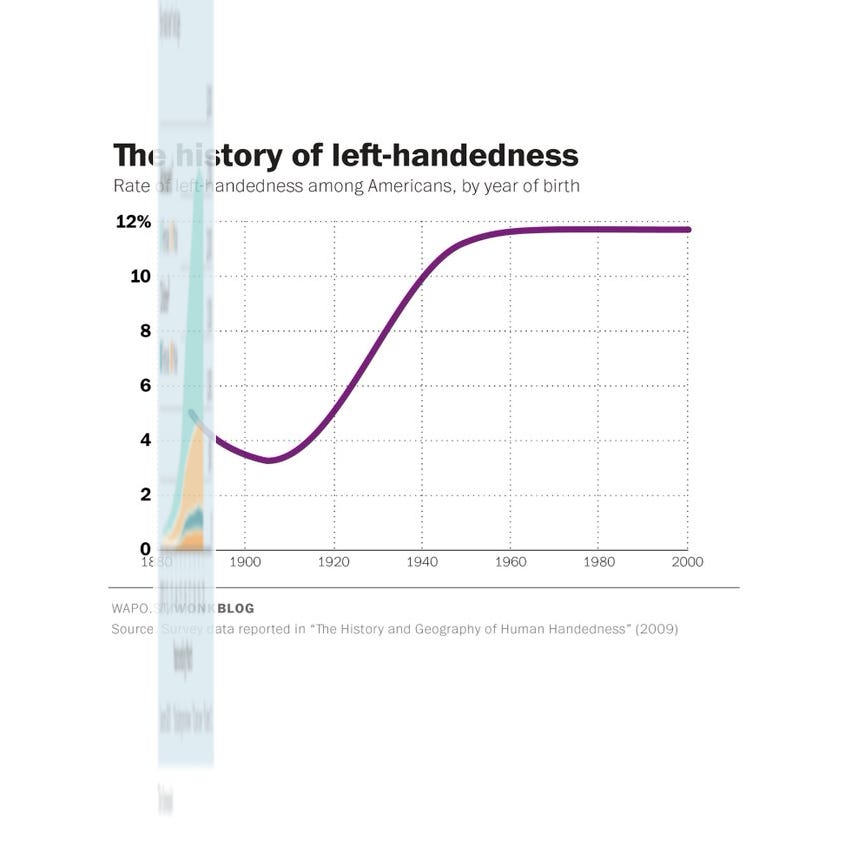
The problem here is the difference in the X and Y scales. In the left-handedness graph the X axis covers a period of 120 years from 1880 to 2000 while the Tavistock graph covers 9 years from 2011 to 2020. The Y-axis of the left-handedness graph goes from 0% to 12% while the Y-axis of the Tavistock graph goes from 0 to 3000. This means that although the slopes on the two graphs appear similar, the data they present is radically different. The left-handedness graph shows that the rate of left-handedness decreased from around 5% in 1880 to 4% in 1900, increased to 12% in 1960 and then remained steady. This is an increase of 200% over 60 years. The graph for referrals to the Tavistock clinic shows around 100 referrals in 2011 increased to over 2000 in 2017, which represents an increase of 1900% over a period of 6 years. An overlay of the two graphs, with the scales adjusted shows the difference in the rate of increase.
The transgender activist argument also misuses the underlying data. in the left-handedness graph. The source of the graph is a 2015 Washington Post article by Christopher Ingraham which in turn references a 2009 book chapter by Christopher McManus. The graph that trans-activists reference is a highly simplified and cropped version of the original graph which covers a period from 1760 to 2000.

McManus examines the prevalence of left-handedness in various time periods, regions and ethnic groups and proposes a theory that the prevalence of left-handedness is influenced by indirect social pressure. Direct social pressure can compel people to switch to using their right hand but will not alter the genetic factors which contribute to left-handedness. However, in a society where left-handed people are stigmatized as clumsy and inferior, they will be considered less desirable marriage partners and therefore less likely to pass on the genes which cause left-handedness. He notes that at the beginning of the 20th century, families where one or both parents were left-handed significantly fewer children than families where both parents were right-handed, but that this difference disappeared by the middle of the century.
There is no way to make a meaningful connection between left-handedness, which is determined by multiple genetic factors which affect brain development, and gender identity, which has no known genetic determinants.
The increase in same sex households after the legalization of same sex marriage gives some indication of the type of increases one would expect from social acceptance of a natural condition. Same sex marriage was legally recognized in Canada in 2005. Census data found that between 2006 and 2016 the number of married same sex couples increased by 300% and the number of same sex couples in general grew by 61%. The United States experience was similar. Between 2008 and 2019 the total number of same sex-couples in the U.S. increased by 56% and the number of married same-sex couples increased by 299%.

During roughly the same period of time, the BC Children’s Hospital Gender Clinic saw new gender dysphoria patients increase by over 1000% from just over 10 in 2009 to over 100 in 2019.

Something else the social acceptance hypothesis does not explain is the reversal of the sex ratio from one in which “assigned male” slightly predominated to one where 75% to 80% of cases are now mainly adolescent “assigned females.”
There are some other graphs that might help explain both the growth in gender dysphoria and the sex-ration switch. For example a graph of YouTube search queries show that from 2009 to the present, there has been a steady decline in searches for anorexia and an increase in searches for transgender. You can run your own comparisons at this link.

Jonathan Haidt has documented the evidence of the negative impact of social media use on teen mental health. Since 2010, when camera smart phones became widely available, there have been dramatic increases in depression, anxiety and hospitalization for non-fatal self-harm among teens. The effect was strongest among teen girls, who are the same group disproportionately represented in the rise in gender dysphoria referrals.
Social contagion through mass-media contributed to the spread of bulimia in the nineteen eighties and nineties. More recently, an epidemic of Tourette’s like symptoms has been traced to social contagion through the social media site Tik Tok. About 87% of the affected patients were female. The United States Surgeon General recently issued an advisory entitled Social Media and Youth Mental Health.
There are also many anecdotal accounts of the role of social media sites like Tumblr in promoting transgender identity in adolescent females. Lisa Littman’s research on detransitioners found that more than 40% said that one or more social media sources were a factor in encouraging their transition.
Correlation plus anecdotal evidence does not prove causation and the hypothesis that gender dysphoria is the result of social contagion remains a hypothesis. However, it is also supported by a plausible mechanism of causation and provides an explanation for the dramatic shift in the sex ratio towards adolescent females. A hypothesis needs to be tested with properly designed research and this is not happening here.
Thank you for your clear and detailed explanation of why the glib "social acceptance" theory of the meteoric rise in trans-identification among teens fits the data for left-handedness so badly -- while "social contagion" via social media explains it so well -- that the transactivist explanation must be regarded as a fallacy.
I've just read a review of Zachariah Elliot's book "Binary", debunking the pseudoscience of sex as as "spectrum", as another all too frequent glib claim on Twitter. There people typically refer airily to "bimodal distribution" -- but clearly with no understanding that bimodal distribution eg of height between the sexes, does NOT mean the overlap between short males and tall females makes them "trans".
It's the same with misuse of so-called "intersex" conditions as a false parallel with trans identification: despite the fact that everyone with a disorder of sexual development (DSD) is still either male or female, depending solely on whether they do or don't have a Y chromosome.
The extensive range of pseudoscience trotted out as trans ideology cult dogma and beliefs seems to rely on a very low educational level in understanding of biology, as well as inability to deal with figures and graphic representations: plus gullibility -- deficits in critical thinking. And for its victims, a degree of distress (for a range of reasons) manifesting or labelled as gender dysphoria, that causes teenage girls especially to clutch at all these straws.
No coincidence either, perhaps, that too many girls are dissuaded from pursuing maths, science and technology by being told they'll be no good at it AS GIRLS. This makes them so much better victims of transgender myths and medical abuse.
Now that’s an essay title. Rip uklg